Sample Microsoft Access Forms and Reports
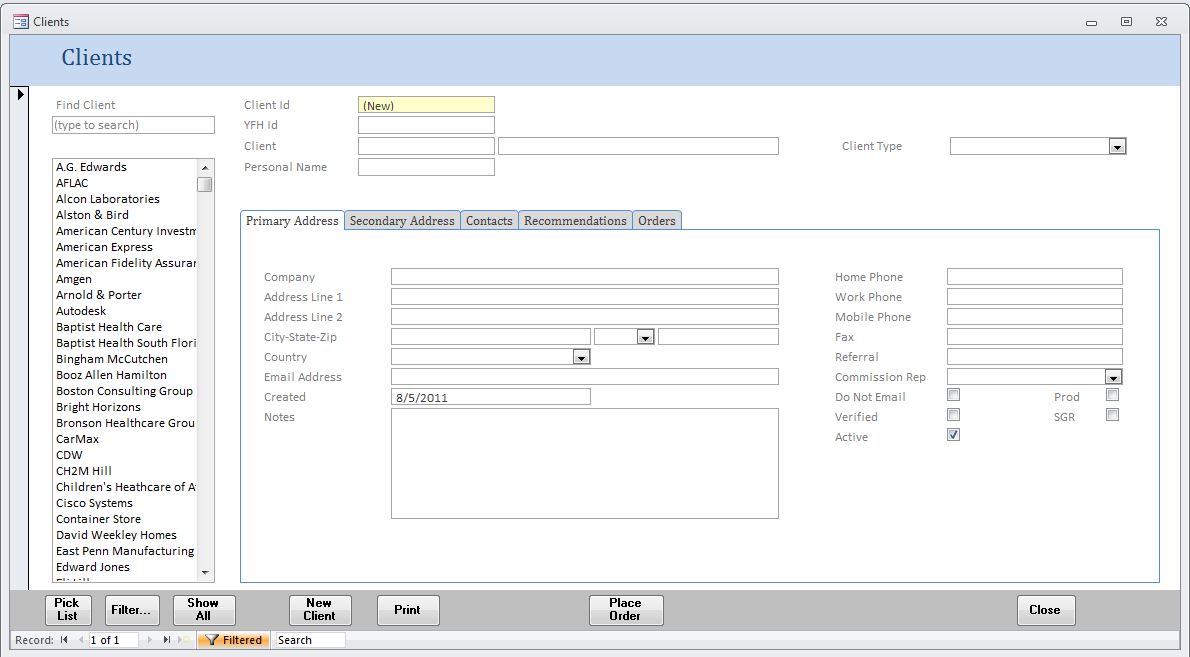
This example shows viewing or entering client information. The search box on the left can be used to quickly find clients by name. This application can be a standalone desktop application, or shared among users in different locations vis Office365.com or AccessHosting.com. Perfect for employees in the field with laptops or for employees who also work out of their house.
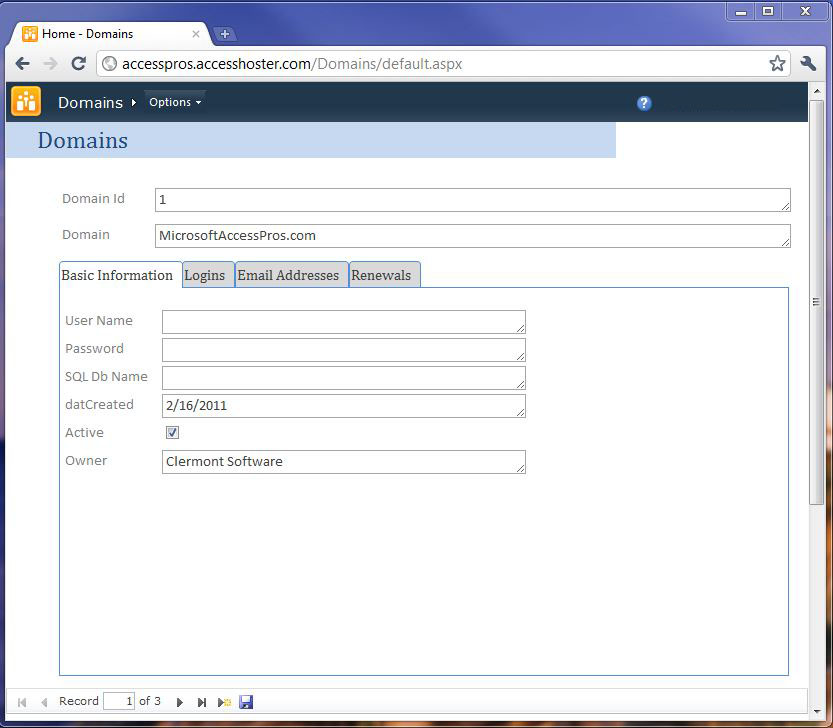
This is an example form for a web database. The database is quickly developed using Microsoft Access 2010, then published to a Sharepoint 2010 site, allowing users to view and edit data, and even view reports straight from their favorite browser! The same familiar user interface can be used in desktop applications too.
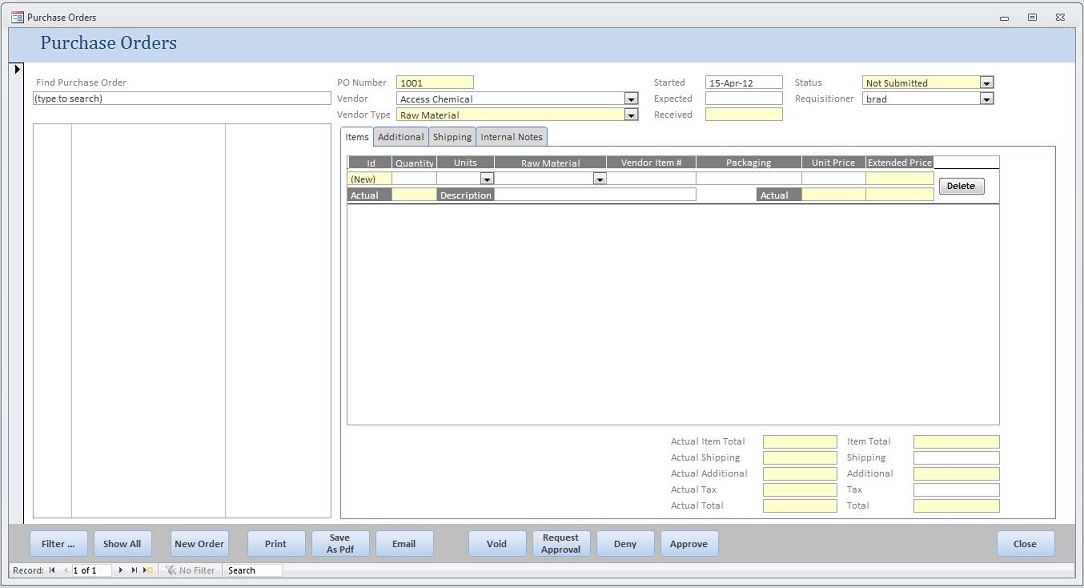
This is an example of a Purchase Order form for entering, getting approval for, submitting, and receiving items via Purchase Orders. This ties directly into the clients inventory and raw material purchases, greatly simplifying the entire process. Employees can view expected receiving dates and ensure materials have been ordered.
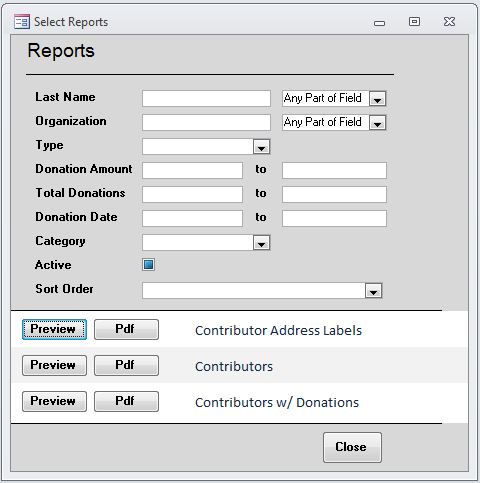
This is an example of a report selection form. Users can either preview the report on screen, or send the report to a pdf file. The report can be filtered by any of the fields at the top, for instance, selecting all Contributors who gave donations totaling between $5,000 and $10,000 and also who gave a donation in 2011. The reports can also be sorted by either contributor last name, or organization name. This report selection/filtering form can easily be customized for your needs.
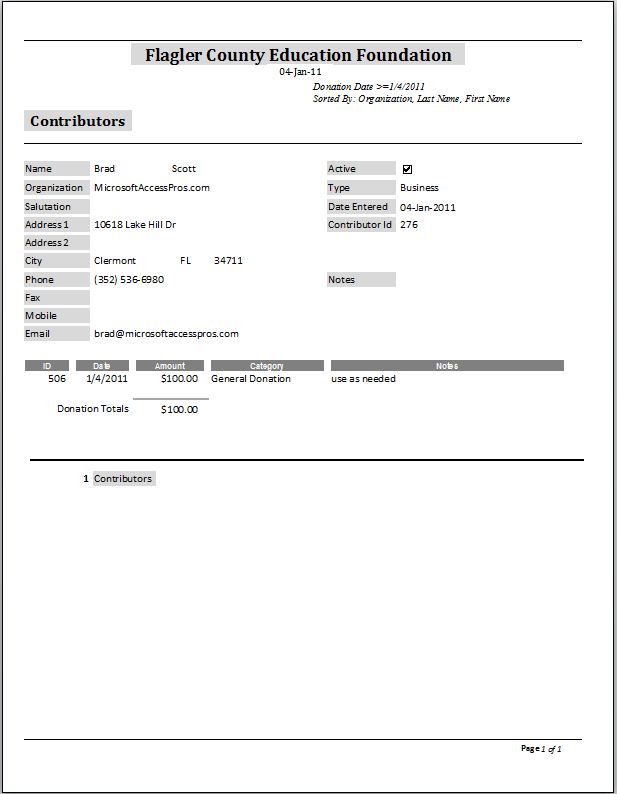
This is an example report generated from the selection process shown in the previous image.
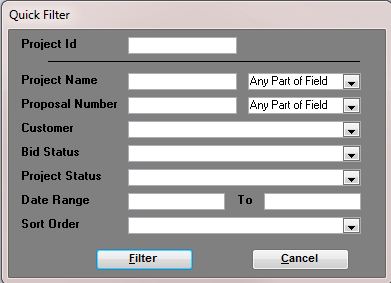
The "Quick Filter" allows filtering all records on a form to a smaller set based on the most common fields used for searching, allowing the user to find what they want quickly.
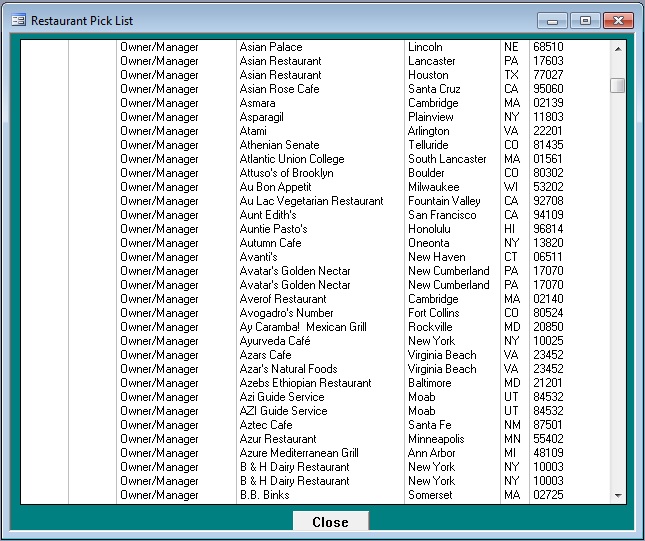
The "Pick List" displays all records found by the Quick filter or any filter. It allows users to single click on any entry and move the main form to the selected record. It is much easier to find the record you want versus drop-down list boxes, and it is easy to move from record to record.
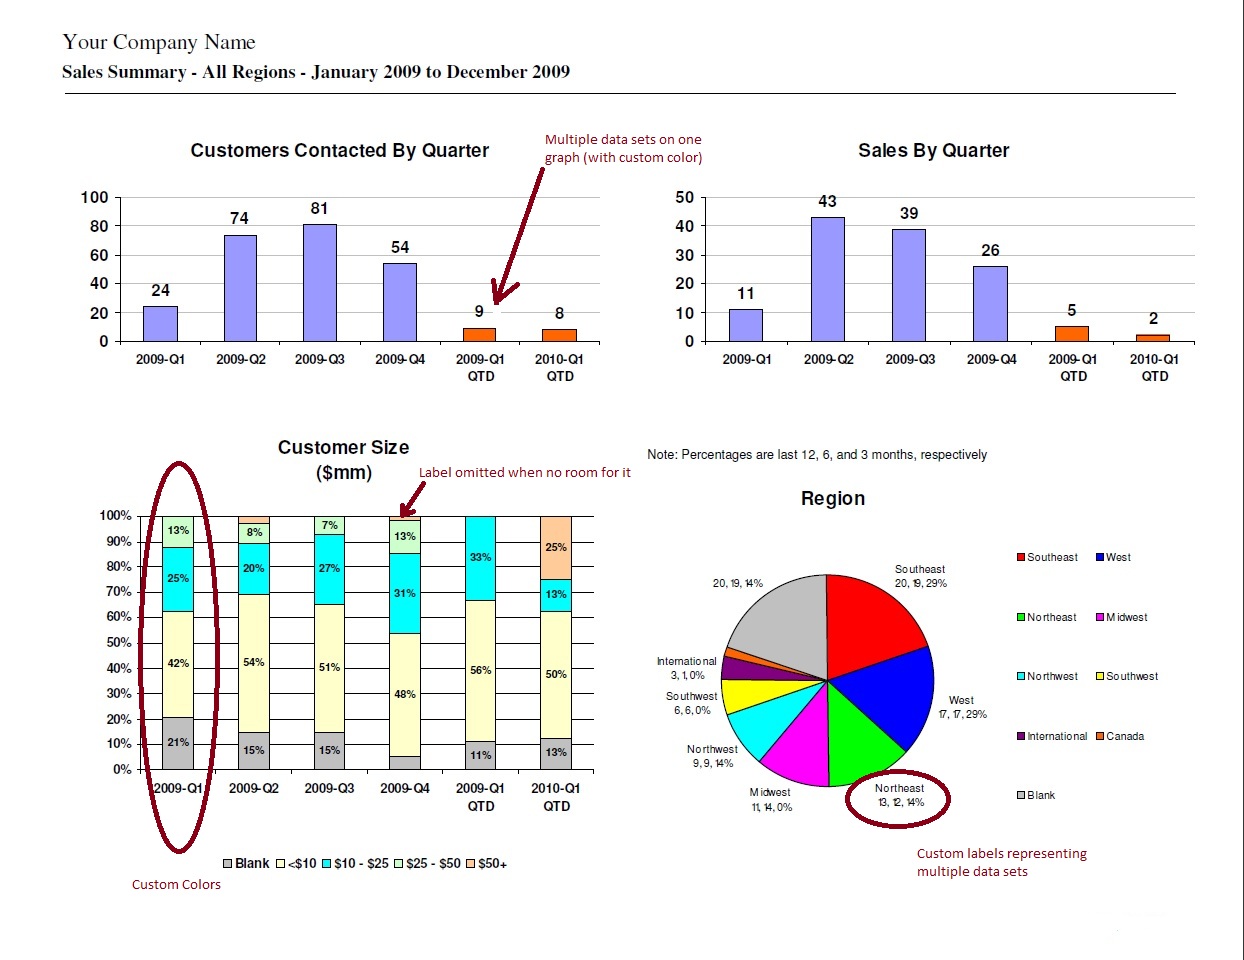
This image shows sample bar, stacked bar, and pie graphs. The graphs can be customized to include multiple data sets, custom labels, and custom colors.
